NFL History - Super Bowl Squares
Updated Feb. 9, 2026 (Results through Super Bowl LX)
More postseason results and history:
- NFC Championship Game Results
- AFC Championship Game Results
- Super Bowl Results
- Super Bowl MVPs
- Super Bowl All-Time Record
- Super Bowl 61 Odds
UPDATE: Kenneth Walker III and the Seattle Seahawks beat the New England Patriots 29-13 in Super Bowl LX in Santa Clara, CA.
For those who will participate in a Super Bowl Squares office pool, you won't have any idea what your numbers will be when you select your square(s). Instead, you will find out after all 100 squares have been filled.
If you're unfamiliar with how the process works, the numbers are based on the final score for each team at the end of each quarter, half or the game. So, in other words, a score of 3, 13, 23, etc. would count as a "3" in terms of the pool.
When you find out your numbers, you will immediately have a sense of whether your numbers are good or bad. For example, you know that getting a 7 and 3 is good. You know that getting a 5 and 2 is not. (Typically anyways.)
Several years ago, those were the exact numbers that I got (5 and 2).
Ugh!
Although I knew my odds were slim, I wasn't sure exactly how slim. I thought it would be an interesting (yes, I need to get a life!) exercise to run through all of the past Super Bowl boxscores to see which numbers have come up the most and least often.
With 60 Super Bowls now in the books and four quarters per game, that means there have been 240 quarters and a total of 480 scores (240 quarters times two teams).
The most common number overall is 0 and especially so in the first quarter. Although its occurrence declines each quarter from the first to fourth, the number 0 has come up 131 times out of 480 possible outcomes (or 27.3%). In the first quarter, it has come up nearly half the time (56 of 120) but only 13.3% of the time in the fourth quarter (16 of 120).
The least common number overall is 5, which has occurred 12 times out of 480 (or 2.5% of the time).
Below is a full chart of the results:
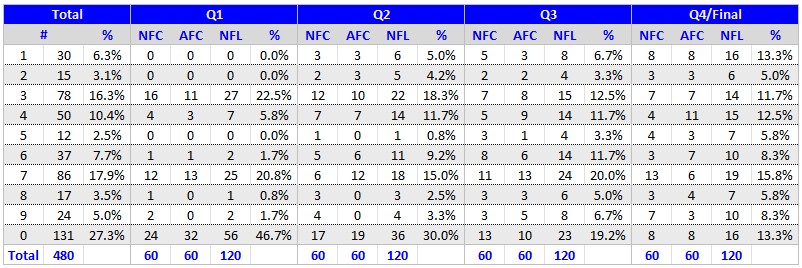
[Results are updated through Super Bowl 60.]
Here's hoping that you get 0's and 7's (and not 5's) in 2027.